5.1.6.4 Scenario phase 4: Developing and parameterizing the socio-ecological model

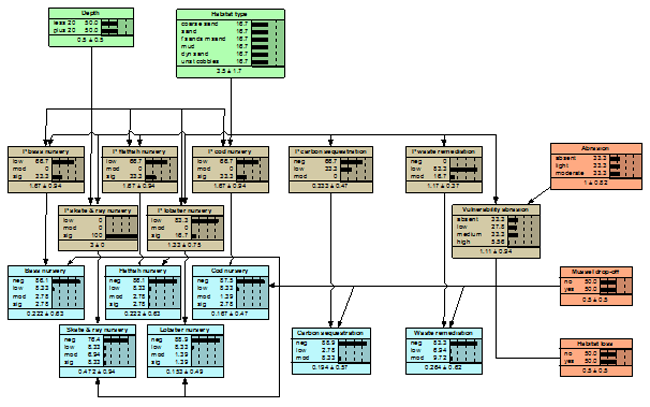
A Bayesian belief network (BBN) model was developed to represent the Pressure - State - Impact relationships for subtidal seabed habitats. Nodes comprised four main types:
- GIS derived nodes take data directly from the geospatial database (e.g. habitat type, depth);
- Pressure nodes represent spatial configuration and intensity of pressures under the current pattern of usage and were conditioned to simulate the management scenarios;
- Potential service nodes, showing the potential for ecosystem service provision based solely on geospatial criteria;
- Actual service nodes, representing the influence of pressures on the delivery of ecosystem services, using stakeholder derived weightings to aggregate values.

Figure: Socio-ecological model structure (GIS derived nodes are shown in green; Pressure nodes, brown; Potential service nodes, grey; and Actual service nodes in blue.
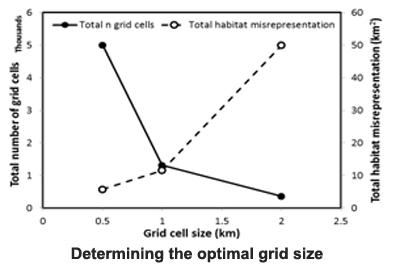
The underlying habitat map was gridded using the majority habitat within each and the optimal grid size of 1km2 was selected that most accurately represented the underlying habitats (low misrepresentation) and was not unduly computationally intensive (not excessive numbers of grid cells, Figure 11). Grid cells were removed if from the analysis if they:
- contained >50% sea along the landward boundary;
- did not fall within the NDBR seaward boundary; or
- were classified as rock biotopes.
These steps resulted in the final habitat map that was used as the base layer for the socio-ecological model comprising 1142 grid cells. All other layers were gridded to 1km2. Scenario pressure layers were gridded, if ≥50% of a grid cell was within a proposed development it was classified with the resulting pressure.

Information on the relationship between pressures, subtidal sediments and their capacity to provide ecosystem services was used to construct conditional probability tables to underpin causal relationships within the socio-ecological model.
The model was run for every grid cell in the habitat base layer: 1) without pressures to generate potential service provision maps for each service type, and 2) with the fishing abrasion pressure map (derived from demersal fishing intensity maps) to generate service provision maps that best represent our understanding of current service delivery in the case study area.
In order to consolidate the information into a single map of aggregated services, stakeholders were asked to weight the different services and the different fishery species, which demonstrated that nursery habitats, in particular for bass, were prioritised.
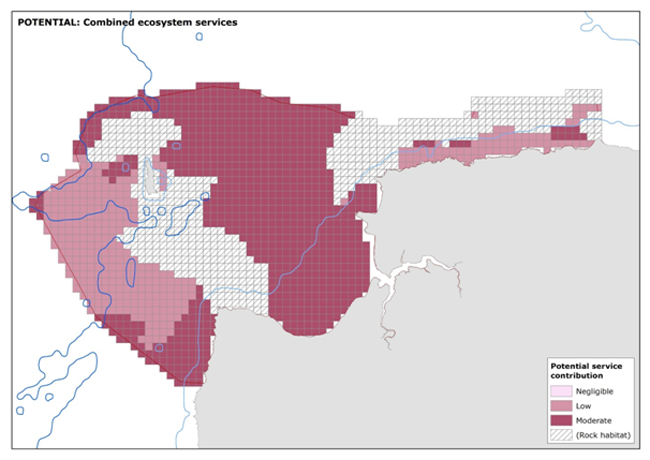
The combined ecosystem service map for potential provision (not taking into account current pressures) shows moderate levels of ecosystem service delivery throughout much of the North Devon Biosphere Reserve.
Lower levels of service provision is estimated for the western part and off the north coast due to coarse sediment habitat types that have negligible carbon sequestration and nursery value for plaice, bass, sole and lobster.
 Figure: The potential combined delivery of nursery habitat, waste processing and carbon storage services across the North Devon Biosphere Reserve, aggregated to take account of stakeholder preferences.
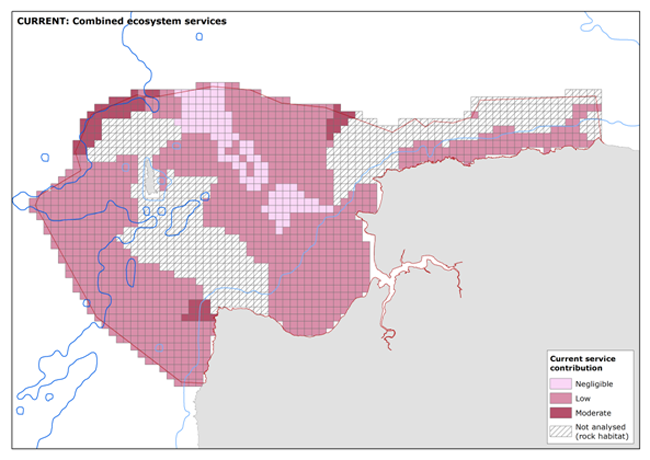
The final map of the current status of aggregated service delivery (taking account of potential impacts from fishing activity) highlighted the importance of, Hartland Point, northwest of Lundy and near the Morte platform in the provision of the services considered.
 Figure: Assessment of the current provision of ecosystem services, based on current patterns of fishing pressure. This represents combined delivery of nursery habitat, waste processing and carbon storage services across the North Devon Biosphere Reserve, aggregated to take account of stakeholder preferences.

