4.3.6 TOOLS TO REPRESENT THE SYSTEM, PRESENT AND COMBINE INFORMATION, SYNTHESIZE KNOWLEDGE


At different steps of the VALMER approach (ecosystem service assessment and scenarios building process), it can be useful to find a way to visually represent the information collected in order to organise and share them with stakeholders.
Many tools can be used to complete diagrams; some are simple while others are of a higher technical level. Nevertheless, depending on the experience and resources of the teams, they can be very useful tool.
Time: many weeks to many months
Technical level: 1 /4
Resources needed: CMAP or Mindjet Mind Manager software
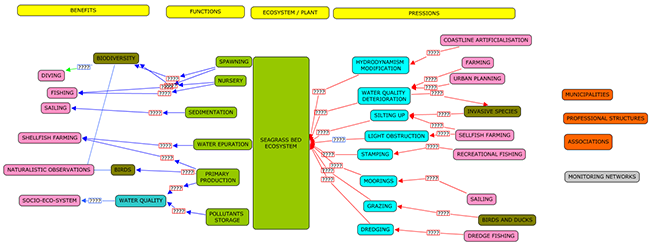
CMAP tools ®
This software can be freely downloaded from the Internet. It will be helpful to work in a cooperative way from an early stage, either alone or in small groups to draw diagrams of a system. It is easy to use and can be seen as a way to organise “post-its” on a computer.

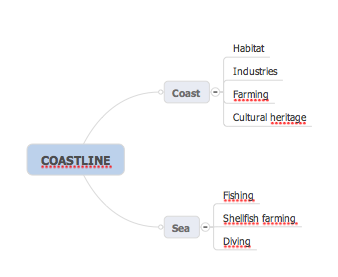
Mindjet Mind Manager ®
This is commercial software that helps to represent the system hierarchically.
The 2 software tools represented are useful for internal work on phase 1 but it is essential to think about how to present the information collected and how to make it available for stakeholders, decision makers and policy makers, because the type of information collected during the work can be of many types (qualitative, quantitative, texts, maps (images and GIS), photos, films, and even modelling in some cases).
Most of these elements can be presented on websites and it seems to be a good way to make the information available for decision makers. However, web designers need to be mindful about some aspects of presentation in order to make it clear.
Thought needs to be given to:
- Different levels of knowledge from the very simple to scientific or technical articles, guidelines and reports.
- Different approaches: by a question (“As a manager, how can I engage stakeholders in a process of ecosystem service assessment?”); by location with examples (“The Poole Harbour experience and lessons learned by implementing such methodology”) or by a technical approach (scenarios building, ecosystem service assessment...).
The designer needs to be very careful to identify the target audience so that, the content of the site is appropriate and then explain how that audience can reach their objective, using the information presented on the site.
What cannot be done through the tools presented above is mathematical modelling of natural and social processes. Modelling is useful in order to build an understanding of a complex system in which the relationships cannot be illustrated by simply. An assumption has to be made that there is knowledge about the level of interaction between the different elements of a system. If necessary, tools such as ExtendSIM® can be used (see below).

ExtendSim®
One way to combine the needs of collecting and presenting different kinds of information and perform mathematical modelling is to use the ExtendSim® software which was originally designed for modelling but can be used for different purposes. It uses a hierarchical organisation of the information and presents it in independent blocks. The software includes some ready to use examples, however it is also possible for an advanced user to build their own blocks according to their needs, with graphical interfaces, a dialog box for parameters and a “help” box for comments and documentation [Balle-Beganton et al., 2010].
In addition to the boxes, it is possible to include links to different type of documents (images, videos, pdf, etc.) by making ExtendSim® use other software. Nevertheless, the use of this software supposes a certain level of technical understanding.
By using this software, we are aiming to build platforms to communicate knowledge integration. The objective is to facilitate group sharing of knowledge [Balle-Beganton et al., 2012]. The development of the platform commences at the start of the project and it is used for the discussions with stakeholders and modified through the project in order to make a version so that end-users understand the processes, find information (classified according to different scientific and technical levels), and help them to implement a decision process for management.
Time: at least 6 months
Technical level: 4/4
Resources needed: ExtendSim® software
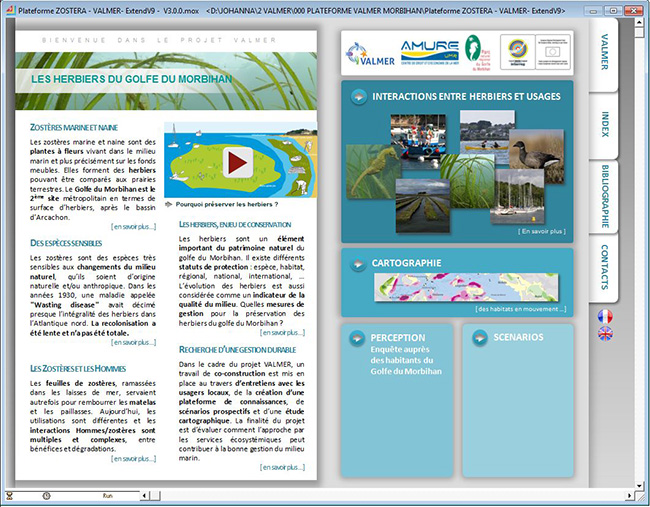
 Figure: presentation of the ExtendSim® platform built for the VALMER project dealing with the seagrass beds in the Golfe du Morbihan in France (draft version, design by J.Beganton, UBO).
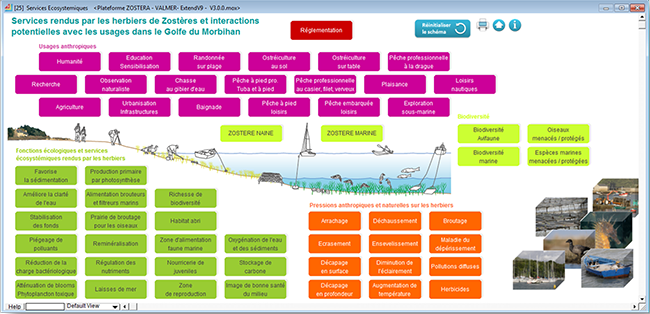
 Figure: elements of the ExtendSim® platform built for the VALMER project dealing with the seagrass beds in the Golfe du Morbihan in France. Presentation of the seagrass beds system (ecosystem services, interaction with activities, impacts, pressures. Draft version, design by J.Beganton, UBO, January 2015).
Links

